Tenth in a series on swing states
After 2016, Ohio’s status as a swing state was in jeopardy. No Republican had ever won the presidency without it, but when Democrats didn’t beat them, they kept it close — a three-point loss for Al Gore, a two-point defeat for John F. Kerry. Donald Trump had lost the state’s primary and was loathed by popular then-Gov. John Kasich, which encouraged Democrats to keep investing in the state.
It didn’t end well for them. Trump shattered the old Democratic coalition in the Midwest and Appalachia, which turned Ohio — an intersection of both regions — into a rout. Hillary Clinton won just 43 percent of the vote, worse than any Democratic nominee since Walter Mondale, and Trump ran ahead of Ronald Reagan in some rural stretches of the state. When the 2020 cycle began, the Democratic PAC Priorities USA didn’t even include Ohio in its national strategy.
Yet here we are, in the final stretch of a presidential election, and both Joe Biden and President Trump are investing in Ohio again. While Republicans are running stronger here than in other “Rust Belt” swing states, like Michigan, Pennsylvania and Wisconsin, they don’t find the same animus toward Joe Biden among working-class White voters that they saw with Hillary Clinton.
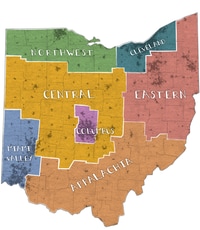
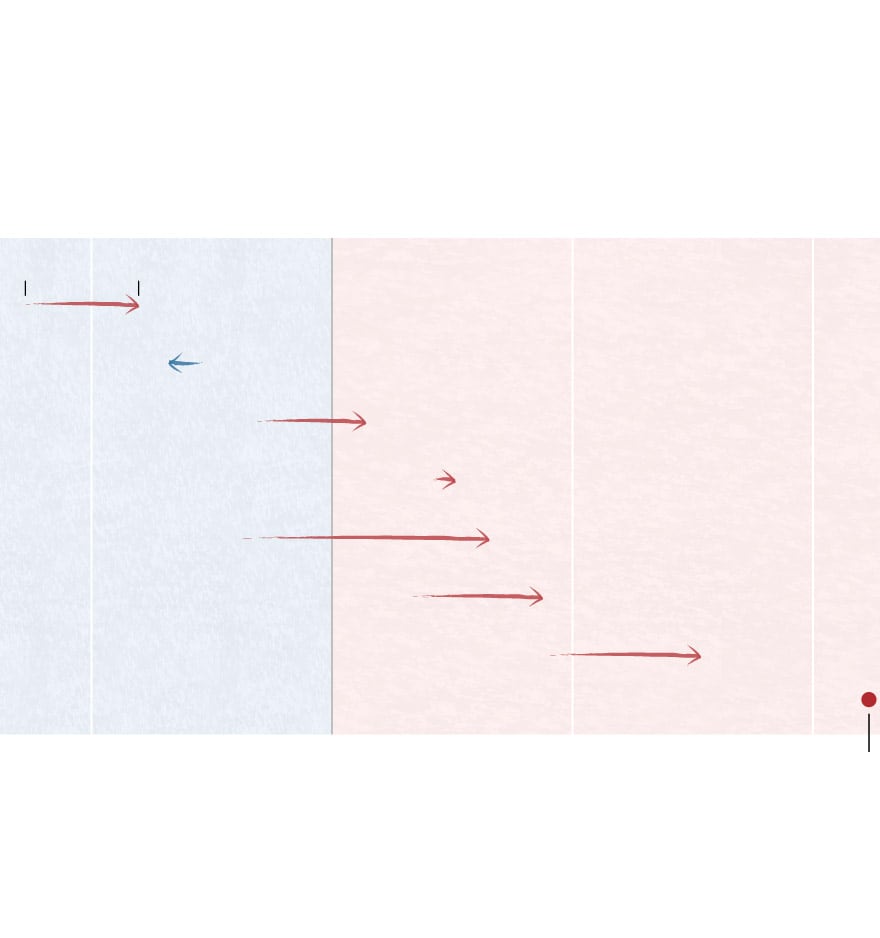
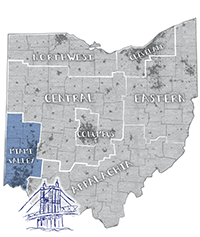
Ohio’s shift from 2012 to 2016
Nearly every region shifted right, handing Trump an easy win in the state.
GOP won
by 400K
Dem. won by
200K votes
2016 margin
Cleveland
Columbus
Northwest
Miami Valley
Eastern
Appalachia
Central
Statewide 2016 margin
Republicans ran stronger than Democrats expected in 2018 as well, holding on to most of those gains from 2016 even as they lost ground in the biggest suburbs.
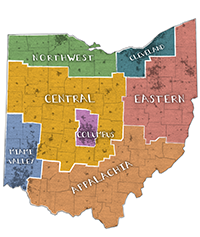
How Ohio shifted from 2012 to 2016
Nearly every region shifted right, handing Trump an easy win in the state. Eastern Ohio saw the greatest shift.
GOP won
by 400K
Dem. won by
200K votes
2016 margin
Cleveland
Columbus
Northwest
Miami Valley
Eastern
Appalachia
Central
Statewide 2016 margin
Republicans ran stronger than Democrats expected in 2018 as well, holding on to most of those gains from 2016 even as they lost ground in the biggest suburbs.
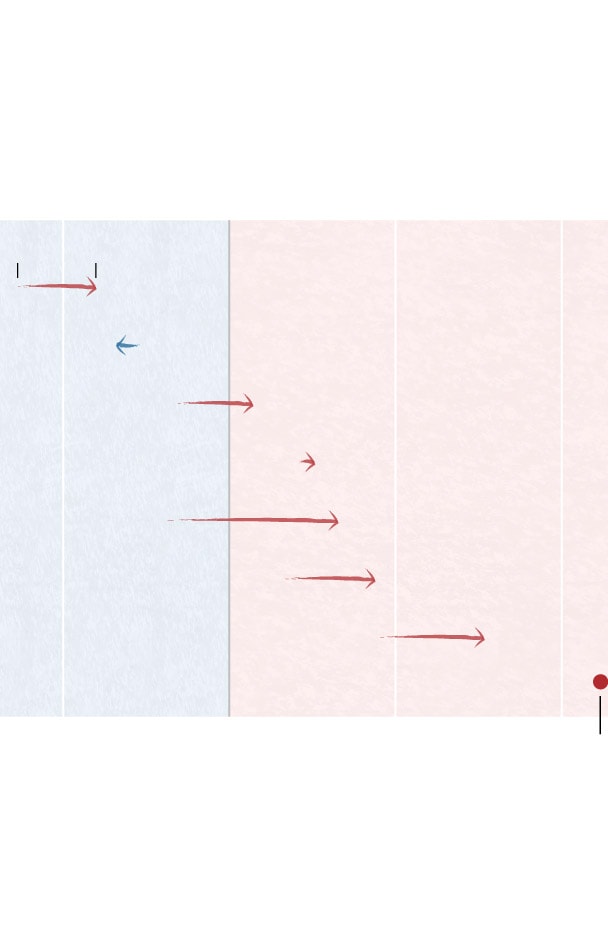
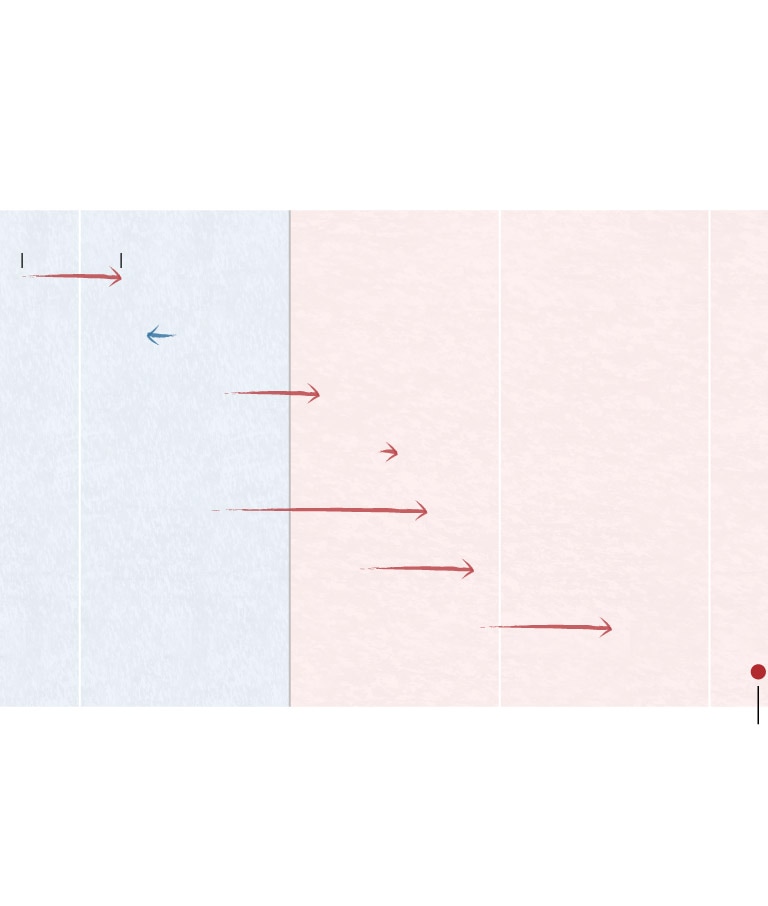
How Ohio shifted from 2012 to 2016
Nearly every region shifted right, handing Trump an easy win in the state. Eastern Ohio saw the greatest shift.
Dem. won by
200K votes
GOP won
by 400K
2016 margin
Cleveland
Columbus
Northwest
Miami Valley
Eastern
Appalachia
Central
Statewide 2016 margin
Republicans ran stronger than Democrats expected in 2018 as well, holding on to most of those gains from 2016 even as they lost ground in the biggest suburbs.
“I don’t think everybody’s coming home, but I think a lot of people are,” said Democratic Rep. Tim Ryan, whose eastern Ohio district has been picked apart by reporters looking for the reasons Trump won the Rust Belt. “After covid, people are calling out his leadership skills. There’s a path here.”
Democrats thought the same thing in 2018, an election that proved how resilient a Trump-era GOP can be in Ohio. While the party swept statewide races in the rest of the aforementioned Rust Belt, it lost all but one of them — Sen. Sherrod Brown’s reelection — in Ohio. Democrats gained ground in the suburbs of Cincinnati, Cleveland and Columbus and retook the towns that run along Lake Erie. Yet even without Trump on the ballot, Republicans gained ground in rural counties, wiping Democrats out in places the party had won for a century.
To understand why that happened, and why the state is still competitive this year, we’ve broken Ohio into seven political “states.” Democrats rack up big margins in just two of them, the metro areas of Cleveland and Columbus. Two of them backed Barack Obama for president twice but have backed Republicans since 2016 — eastern and northwest Ohio. The two largest regions, central Ohio and Appalachia, are now Republican strongholds, with Democrats competing just to lose them by a little less. And the Miami Valley, where most of the vote comes from the cities of Cincinnati and Dayton, is the only one where the GOP’s old coalition may be fraying.
This is the 10th in a series breaking down the key swing states of 2020, showing how electoral trends played out over the past few years and where the shift in votes really mattered. See all 50 states here.
Cleveland
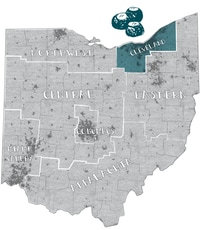
Every swing state in the Midwest has a major city that bustled in the first half of the 20th century, then entered a long period of White flight and decline. In Ohio, that’s the story of Cleveland, which has lost half of its population since the 1950s — many to a Sun Belt diaspora, many to smaller, quieter and more affordable towns down the road. When Reagan won Ohio in 1980, 1 in 7 Ohio votes came from Cleveland’s Cuyahoga County; when Trump won it, the proportion had fallen to 1 in 9. The population of greater Cleveland held steady thanks to growth outside of the city limits.
Those population shifts have also turned Cuyahoga into a place where 1 in 4 voters is Black, and Democrats run up their score even in bad years. Every Democratic nominee since Kerry has won it by more than 200,000 votes, and they clear 95 percent of the vote in some precincts. Clinton’s final push here in 2016 focused on Cleveland, but lower turnout by Black voters hurt her badly. Across the region’s five counties, she won by a landslide, but ran more than 100,000 votes behind Barack Obama’s 2012 total. Republicans lost ground here in 2018 but proved that Democrats can’t just pile up votes in Parma and Shaker Heights and expect to carry the state.
2016 vote totals
- Donald Trump: 400,558
- Hillary Clinton: 561,263
Counties included: Cuyahoga, Geauga, Lake, Lorain, Medina
Eastern
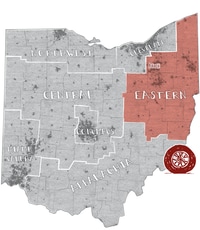
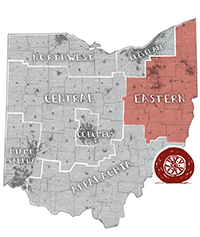
Four years ago, the first signs that Trump could dominate Ohio came from the Mahoning Valley. Tens of thousands of Democratic voters pulled Republican primary ballots, backing Trump over Kasich. From 2012 to 2016, turnout in the GOP primary here doubled; in Mahoning County itself, Trump got more primary votes (17,394) than were cast for every Republican candidate four years earlier (15,105).
That presaged a Republican landslide here. Clinton won bigger cities like Akron, Canton and Youngstown but lost almost everywhere else; Trump’s opposition to free-trade deals and promise of change for declining cities was a perfect fit for the region, hammered by decades of deindustrialization. What had been a 75,000-vote advantage for Obama became a 120,000-vote advantage for Trump. And Republicans retained many of those gains in 2018, with Republican Gov. Mike DeWine dominating the region and Brown losing Canton’s Stark County for the first time ever. There’s a reason Biden stumped in tiny Alliance after the first Democratic debate: Democrats think that some attention, and an emphasis on manufacturing job losses in places like Lordstown, can win back at least some of their old White voters.
2016 vote totals
- Donald Trump: 554,574
- Hillary Clinton: 423,984
Counties included: Ashtabula, Belmont, Carroll, Columbiana, Coshocton, Guernsey, Harrison, Holmes, Jefferson, Mahoning, Portage, Stark, Summit, Trumbull, Tuscarawas, Wayne
Appalachia
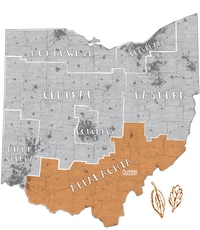
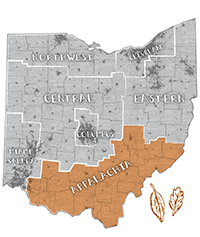
Like in Pennsylvania and West Virginia, Democrats have bartered Appalachia away in a long-term geographical trade. They’ve gained suburban voters restless about climate change and school shootings; they’ve shed conservatives in coal and fracking country. Obama’s 2012 victory made the trade look like a net win. Even while losing these 20 counties, badly, Obama had the numbers in other parts of Ohio to win.
Republicans had more votes to gain, but not many. Running on a promise to bring back the coal industry and coal power, attacking Democrats as effete “globalists,” Trump won landslide victories across Ohio’s stretch of Appalachia. The overall two-party vote declined, but Trump ran 42,000 votes ahead of Mitt Romney, while Clinton shed nearly 60,000 votes off Obama’s losing total. In 2018, Brown, a very different candidate than Clinton, did far worse here than he had in 2012, when he faced a stronger Republican opponent.
2016 vote totals
- Donald Trump: 303,803
- Hillary Clinton: 128,744
Counties included: Adams, Athens, Brown, Clermont, Clinton, Gallia, Highland, Hocking, Jackson, Lawrence, Meigs, Monroe, Morgan, Muskingum, Noble, Perry, Pike, Ross, Scioto, Vinton, Washington
Miami Valley
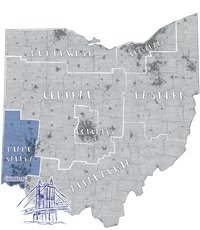
For decades, in close elections, Democrats dominated the towns along the Ohio River but lost in the conservative suburbs of Cincinnati. Republicans carried Hamilton County, anchored by that city, in every election from 1968 to 2004. They haven’t won it since. Clinton’s 10-point margin there was the best for any Democratic presidential candidate since before Clinton herself was old enough to vote; in 2018, the Democratic Party’s statewide ticket romped in Hamilton County, and there’s no evidence that Republicans have recovered.
Outside of Dayton and Cincinnati, even as Democrats flip the suburbs, Republicans are still dominant. Butler County, which sent former House speaker John Boehner to Congress, is now the most populous Ohio county that reliably votes Republican; nearby Warren County is close behind. But this was one of the few parts of the state where Trump didn’t improve on Romney’s numbers, actually running more than 10,000 votes behind the 2012 nominee.
2016 vote totals
- Donald Trump: 554,484
- Hillary Clinton: 451,999
Counties included: Butler, Darke, Hamilton, Miami, Montgomery, Preble, Warren
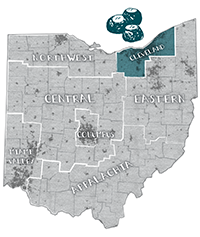
Columbus
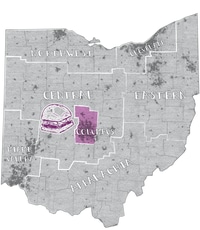
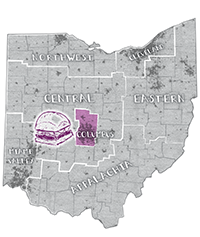
Trump’s rebrand of the GOP was fantastic for most Ohio Republicans. Just not the ones who lived in the Interstate 270 beltway. Fast-growing Franklin County, which contains Columbus, went for Clinton by more than 150,000 votes, a bigger margin than any Democrat had ever won there. She also had real traction in Delaware County, Columbus’s northern suburbs that had voted reliably Republican for generations — even backing Barry Goldwater’s 1964 campaign, when he lost Ohio overall by 26 points.
Republicans lost more ground here in 2018, with their statewide ticket matching Clinton’s margin and Republican Rep. Troy Balderson nearly losing a special election for the gerrymandered 12th District. He lost the Franklin County corner of the district in a landslide, holding on thanks to his numbers in rural areas. Racially diverse, and with an economy that does not rely on manufacturing, it has become an easy fit for Democrats.
2016 vote totals
- Donald Trump: 256,744
- Hillary Clinton: 392,221
Counties included: Delaware, Franklin
Northwest
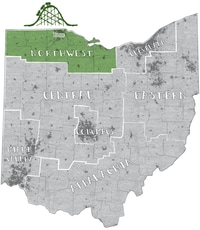
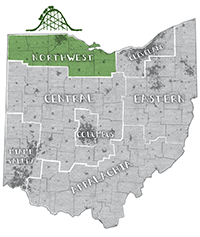
The western shore of Lake Erie swung hard toward Republicans in 2016, a mirror of what happened up the highway in the “downriver” suburbs of Detroit. Obama had won here with a jobs-first message, holding onto the region in 2012 by emphasizing the bailout of the auto industry around Toledo. Four years later, Clinton won Toledo but not a whole lot else. Romney had lost the region by nearly 62,000 votes; Donald Trump would win it by around 28,000 votes.
Led by Brown, Democrats improved slightly across the region in 2018. Toledo’s Lucas County, for example, backed Clinton by just 35,000 votes; it backed Brown by 50,000. West of Toledo, in places where Clinton had been wiped out, Democrats clawed back votes in towns like Defiance. But it should be clear when the rest of the coastal counties come in — Erie, Ottawa and Sandusky — whether Trump’s gains were permanent.
2016 vote totals
- Donald Trump: 234,543
- Hillary Clinton: 206,458
Counties included: Defiance, Erie, Fulton, Henry, Huron, Lucas, Ottawa, Sandusky, Seneca, Williams, Wood
Central
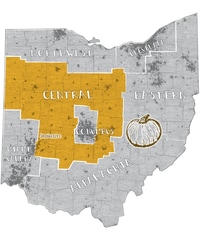
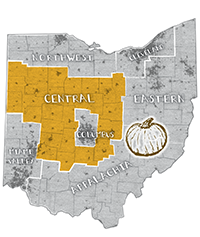
The 2016 Republican ticket did so well in so much of Ohio that it’s tricky to pinpoint one region that swung the state. Trump’s landslides in places that were already strong for Republicans, like these 26 counties, scared Democrats nearly as much as his gains in the Mahoning Valley. Obama had lost this region twice, but not by so much that he couldn’t make up the difference elsewhere. But while Romney won here by around 138,000 votes, Trump racked up a margin of more than 306,000 votes. Had Romney hit those numbers in 2012, and nothing else had changed, he would have won the state.
Could Trump do that again? In 2016, he swept every single precinct in most of these counties, and there might not be many more votes for Democrats to lose. In the region’s small cities, like Lima and Mansfield, Biden faces fewer head winds than Clinton did, and Trump’s promise of a speedy economic comeback is harder to pitch after four years. But Trump’s conservatism is an easy fit here, and even the most optimistic Democrats see a slightly smaller landslide defeat in the region as the best they can do.
2016 vote totals
- Donald Trump: 535,847
- Hillary Clinton: 229,412
Counties included: Allen, Ashland, Auglaize, Champaign, Clark, Crawford, Fairfield, Fayette, Greene, Hancock, Hardin, Knox, Licking, Logan, Madison, Marion, Mercer, Morrow, Paulding, Pickaway, Putnam, Richland, Shelby, Union, Van Wert, Wyandot