Third in a series on swing states
For a long time, Republicans who ran for president didn’t have to worry about North Carolina, even when Democrats did well down ballot. Democrats have held the governor’s office here for all but four years this century, and since the 1970s, no Senate race here has been won with more than 55 percent of the vote. And until 2010, Democrats controlled the legislature, drew the state’s maps and kept conservatives locked out of power.
That changed with the 2010 tea party wave, and since 2016 the state has been gripped by partisan warfare between Democratic Gov. Roy Cooper and a Republican legislature that has limited his power to defy them. In the past 10 years, Republicans drew maps and passed voting laws that repeatedly have been struck down as unfair, with one map judged to have targeted Black voters “with surgical precision.” North Carolina has become a microcosm of America: Cities and suburbs have grown bluer, White rural areas have grown redder, and, when one party wins, it makes the place inhospitable for the other one.
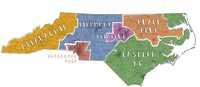
N.C.’s shift from 2012 to 2016
The Triangle swung further left while the three regions Romney won grew redder.
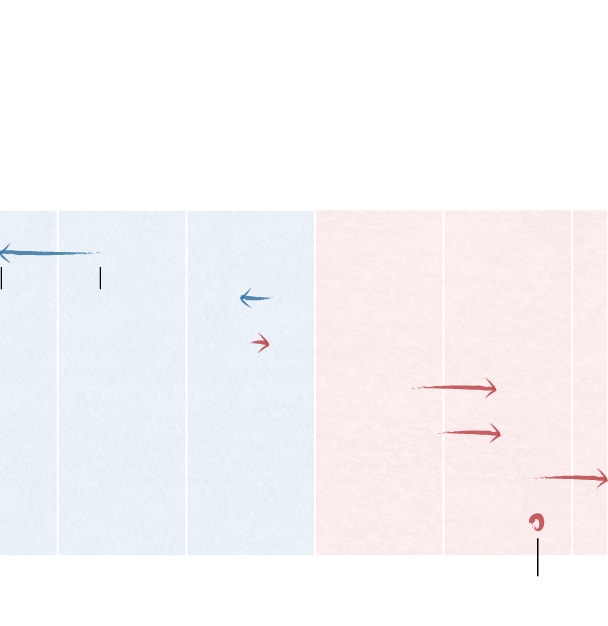
D won by
200k votes
R won
by 200k
Triangle
Charlotte Area
2016
margin
Black Belt
Eastern N.C.
Appalachia
Piedmont
Statewide 2016 margin

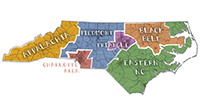
North Carolina’s shift from 2012 to 2016
The Triangle swung further left while the three regions Romney won grew redder.
Dem won by
200k votes
GOP won
by 200k
Triangle
Charlotte Area
2016
margin
Black Belt
Eastern N.C.
Appalachia
Piedmont
Statewide 2016 margin

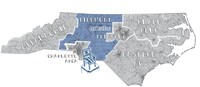
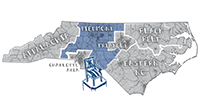
North Carolina’s shift from 2012 to 2016
The state became more polarized, as the Triangle swung further left while the three regions Romney won grew redder.
Dem won by
200k votes
GOP won
by 200k
Triangle
Charlotte Area
2016
margin
2012
margin
Black Belt
Eastern N.C.
Appalachia
Piedmont
Statewide 2016 margin
Yet presidential races here have gotten competitive ever since 2008, when Barack Obama became the first Democratic candidate in 32 years to win it. Obama didn’t need North Carolina to carry the electoral college, and he lost the state in 2012, but it has become a place Republicans need to compete for.
Three in 10 of all voters in 2016 were non-White, according to exit polls, and they backed Hillary Clinton by 61 points. White voters backed Trump by 31 points, but that was a smaller margin than Republicans got out of the White electorate in Georgia (54 points) or Texas (43 points). One reason: Most of North Carolina’s White voters hold college degrees, and that demographic, once solidly Republican, began to move in 2016.
Unlike parts of the Midwest, where defeat in 2016 came during a decline in Democratic turnout, the party actually gained ground with the Clinton-Kaine ticket. It added more than 10,000 votes, but it did so while trading voters in rural areas for gains in the suburbs of Charlotte, Raleigh and other cities.
Republicans gained nearly 90,000 votes, as support for third parties surged from 60,000 votes to nearly 200,000 votes. But that did not push North Carolina off the map. In this year’s polls, Joe Biden has remained tied or ahead of the president, Cooper has held a wide lead in his reelection bid, and Republican Sen. Thom Tillis has frequently trailed Democratic challenger Cal Cunningham.
To explain why a Trump-won state remains so competitive, we’ve sorted North Carolina into six political “states.” In each of them, small shifts in the vote could be decisive — and in some of them, there may not be many more votes to switch.
This is the third in a series breaking down the key swing states of 2020, showing how electoral trends played out over the past few years and where the shift in votes really mattered.
Research Triangle
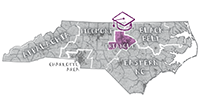
Much of the Democratic Party’s optimism about North Carolina comes from here, the fast-growing area around the state capital, the University of North Carolina at Chapel Hill and Duke University. Every four years, it casts more of the vote. Residents of Wake County alone cast 442,245 ballots in 2008, 486,427 ballots in 2012 and 527,624 ballots in 2016. Democrats’ margins grew, too, as precinct after suburban precinct turned away from the GOP.
The region is now downright hostile to Republicans, with their margin of defeat expanding by 75,000 votes from 2012 to 2016. In a typical academic year, there are about 100,000 college students living in the region each November. Pandemic conditions will lower that number; any Democratic gains will come from the steady migration of suburban voters away from the Trump-era GOP.
2016 vote totals
- Donald Trump: 260,314
- Hillary Clinton: 505,196
Counties included: Chatham, Durham, Orange, Wake
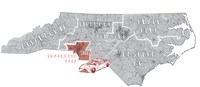
Black Belt
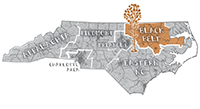
Stretching from southern Virginia to the tip of East Texas, the “black belt” has always had a double, overlapping meaning. It had some of the richest, blackest soil in the country, and to till it, plantation owners enslaved millions of people. Even now, decades after the Great Migration, these mostly rural counties have sizable Black populations or even Black majorities. When Republicans redrew the electoral maps nine years ago, they packed voters from the Black Belt together with voters from Durham, shoring up Democratic Rep. G.K. Butterfield but making nearby Republican-friendly seats markedly Whiter.
In 2016, when Hillary Clinton turned out fewer Black voters than Barack Obama had in his two presidential races, Democratic margins shrunk here just as they did in Detroit and Milwaukee. Four counties flipped from blue to red (Granville, Nash, Gates, Martin), and only Pitt County, with the city of Greenville, got more Democratic. The decline was worth tens of thousands of votes, not decisive statewide, but one more problem for a Democrat trying to beat the Republican strength in the other rural parts of the state.
2016 vote totals
- Donald Trump: 153,911
- Hillary Clinton: 190,001
Counties included: Bertie, Edgecombe, Franklin, Granville, Halifax, Hertford, Martin, Nash, Northampton, Pitt, Tyrrell, Vance, Warren, Washington, Wilson
Appalachia
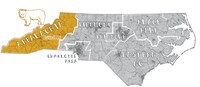
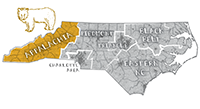
Republicans won western North Carolina long before they conquered other parts of once-Democratic Appalachia. In 2000, George W. Bush carried every single county here, and in the decade-plus since, the party has taken back a Democratic-held House seat and elected some of its most conservative members of Congress and the state legislature. Mark Meadows, the Freedom Caucus leader turned White House chief of staff, won four terms here easily, thanks to a map that split Asheville — by far the biggest and most liberal city here — into two districts.
Asheville’s Buncombe remains the only part of the region that puts up big Democratic margins, though Clinton actually won Watauga County, home to Appalachian State University, after Barack Obama had lost it. That hardly mattered, as Donald Trump won nearly 40,000 more votes here than Mitt Romney.
2016 vote totals
- Donald Trump: 351,516
- Hillary Clinton: 207,472
Counties included: Alexander, Alleghany, Ashe, Avery, Buncombe, Burke, Caldwell, Cherokee, Clay, Graham, Haywood, Henderson, Jackson, Macon, Madison, McDowell, Mitchell, Polk, Rutherford, Swain, Transylvania, Watauga, Wilkes, Yancey
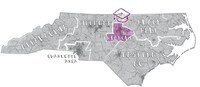
Charlotte Area
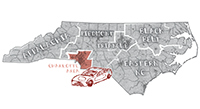
North Carolina’s biggest city wasn’t a Democratic stronghold until fairly recently. Republicans held city hall for 22 years, losing it narrowly during Barack Obama’s presidency, and Obama was the first modern Democratic presidential candidate to decisively win Charlotte’s Mecklenburg County. John Kerry won it by 11,744 votes, a margin Obama grew to 100,110 votes in 2008 and Hillary Clinton expanded to 139,044 votes. And when Republicans abandoned plans to host their convention in Charlotte, voters told pollsters that they approved.
Charlotte’s growth has powered new development in its surrounding counties, but it has not turned the entire region blue. That has been crucial for Republicans — their dominance in Cabarrus, Gaston and Union counties erases much of the Democratic strength in Charlotte, and only in close suburbs such as Concord did the GOP lose any ground in 2016. In 2019, Republicans held on to the old 9th Congressional District thanks to a 21-point win in exurban Union County — and that was their smallest margin out of the county in years.
2016 vote totals
- Donald Trump: 337,913
- Hillary Clinton: 395,636
Counties included: Cabarrus, Gaston, Mecklenburg, Union
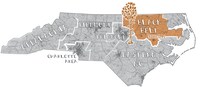
Eastern N.C.
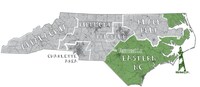
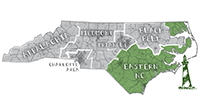
Donald Trump’s 2016 North Carolina victory had a lot to do with the few conservative Democrats still voting here deciding, finally, to bolt. Clinton lost Bladen and Robeson County after Barack Obama had won them twice; closer to the Outer Banks and the rest of the Atlantic Coast, she lost even more decisively. Only New Hanover County and the city of Wilmington got friendlier to Democrats, and only barely, with both Trump and Clinton winning more votes than the party’s 2012 nominees.
Most of the state’s military bases are here, from Fort Bragg in Fayetteville to the Marine Corps’ air station at Cherry Point. Until 2019, much of the region was represented in Congress by Republican Walter Jones, a former Democrat and deficit hawk who abandoned his support for the Iraq War and began voting against basically any bill that added debt or might lead to military intervention. He won his last term over stiff primary challenges, and after his death, a Trump-friendly Republican replaced him, reflecting the new politics in this part of the state.
2016 vote totals
- Donald Trump: 537,049
- Hillary Clinton: 396,429
Counties included: Beaufort, Bladen, Brunswick, Camden, Carteret, Chowan, Columbus, Craven, Cumberland, Currituck, Dare, Duplin, Gates, Greene, Harnett, Hoke, Hyde, Johnston, Jones, Lenoir, New Hanover, Onslow, Pamlico, Pasquotank, Pender, Perquimans, Robeson, Sampson, Scotland, Wayne
Piedmont
The state’s old tobacco-growing counties got redder in 2016, with Democrats losing some ground everywhere outside the region’s biggest cities, Greensboro and Winston-Salem. Everything else stayed red, but the shift was relatively minor, and Gov. Roy Cooper ran ahead of Clinton nearly everywhere. In some parts of the country, the GOP is making new inroads with White voters; here, it may have maxed out its gains already, but at a scale that makes it tricky for Democrats to win statewide.
From 2012 to 2016, the Republican ticket added about 35,000 votes across the Piedmont region; Democrats lost more than 21,000 votes. Gov. Roy Cooper ran only marginally ahead of Clinton, demonstrating just how inflexible partisan sentiment has become here — and how winning the reddest parts of the state by a bit less can wipe out the GOP’s strengths.
2016 vote totals
- Donald Trump: 722,200
- Hillary Clinton: 494,938
Counties included: Alamance, Anson, Caswell, Catawba, Cleveland, Davidson, Davie, Forsyth, Guilford, Iredell, Lee, Lincoln, Montgomery, Moore, Person, Randolph, Richmond, Rockingham, Rowan, Stanly, Stokes, Surry, Yadkin
